
Detecting Anomalies In Windows Authentications Using an Hierarchical Bayesian Framework
UEBA

By Iwona Hawryluk (Data Science Intern), Henrique Hoeltgebaum (Senior Data Scientist) and Joshua Neil (Chief Data Scientist)
Editor’s note: This paper was originally presented as “Peer-group Behaviour Analytics of Windows Authentications Events Using Hierarchical Bayesian Modelling” in the AAAI-23 workshop on Artificial Intelligence for Cyber Security and available in Cornell University’s arXiv [1].
One challenge and opportunity in user and entity behavior analytics (UEBA) is to learn from a group of users to inform the detector about one individual user’s behavior. This can be very powerful in identifying users who are not behaving similarly to their peers, and borrowing strength when building baseline models from populations in order to accelerate learning on individuals.
In this project, our goal was to build a statistical model that could detect anomalous behavior in the hourly numbers of unique target assets that users authenticate to (which we will refer to as just authentications for the remainder of this post) in order to identify password spray and horizontal port scans, among other use cases. Depending on the usual behavior of a user, a high number of destination authentications might indicate that their account has been compromised and someone is trying to perform reconnaissance, for example. But for some users high numbers of authentications are not suspicious, e.g., network administrators authenticate too many endpoints due to the nature of their job. To capture this variability, a model for each user is necessary.
The main challenge in anomaly detection for authentications lies in defining what ‘normal’ behavior is for each employee. HR records provide a natural way of grouping people with similar characteristics, however using those to determine if a user is deviating from their peers is far from ideal. For example, the manager of a team will have very different authentication patterns than their direct reports. Identifying the right peer groups for each user is critical to high quality threat detection, and our approach is to do so based on the authentication behavior rather than predefined organizational data.
Denote \( y \) as the hourly aggregated counts of the number of distinct entities that each user authenticated to. Henceforward we refer to this unique number of target entities a user authenticates to simply as authentications. Taking each user time series as an i.i.d. event and, knowing that overdispersion was not observed in our data set, define \( y \sim Poisson(\lambda) \), where \( \lambda \) refers to its unconditional mean.
We considered for our analysis:
The proposed models are fitted to the training sample while anomaly detection is performed by comparing predictions from those models to the observed values within a testing sample. Users who have observations in the test set but not in the training set are removed. In addition, users with less than 10 observations in the training set are also removed from the analysis. Applying those criteria we end up with 7504 users and 400 timestamps in the training set and 168 timestamps in the test set.
The proposed framework is split into a two-stage procedure. During the first stage, users are clustered given their authentication time series, whereas in the second stage, time series models are proposed to capture the normal behavior within the peer group. In the following, we provide more details regarding both stages.
For our research, four different approaches were proposed, in addition to the use of HR data, to cluster users given their authentication behavior. Denote \( A \) as the adjacency matrix which maps the number of connections each user did to different destination targets. The data-driven clustering algorithms are defined as the following:
When considering enterprise network data, it is a well established fact that employees tend to log in more often during working hours and weekdays. Encoding this information in the model will allow the analyst to evaluate if the user’s behavior is deviating from its peer group, authenticating to distinct machine(s) outside working hours.
In addition to seasonality, exploratory data analysis revealed that the authentication method’s behavior (NTLM or Kerberos) was distinct throughout the day and week, within and across groups. Having in mind the UEBA component of this work, we address this issue by proposing a hierarchical Bayesian structure. If fixed effects models were considered, not splitting the effect of the authentication method, the accuracy of the estimated average behavior would be affected, producing a poor fit. Hierarchical random effects would pool this information across units in order to obtain the most accurate estimate for each method.
With these components in mind, in [1] we proposed six competing models (henceforth abbreviated as \( M \)). No grouping structure is adopted in \( M_{1} \) and \( M_{2} \), while the last four models (\( M_{3} \), \( M_{4} \), \( M_{5} \) and \( M_{6} \)) adopt one of the four proposed data-driven or HR grouping methods. The seasonality component is not present in \( M_{1} \) and \( M_{3} \). In \( M_{2} \) the seasonality is modeled taking into account the whole population, while \( M_{4} \), \( M_{5} \) and \( M_{6} \) explicitly capture the seasonality pattern within each group. \( M_{5} \) adds an extra coefficient to model the authentication method effect within the group (Kerberos or NLTM) while \( M_{6} \) adds a hierarchical structure which pools authentication method information across users within the same group. Table 1 provides a summary of the different features from each model.
Table 1
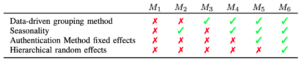
\( M_{1} – M_{6} \) represent models based on HR grouping methods and variables.
For brevity we present next only the complete model (\( M_{6} \)) as
\begin{eqnarray}\nonumber
y_{h,d,g,m} &\sim& \text{Poisson}(\lambda_{h,d,g} \times \psi_{m,g})\nonumber\\
\text{log}(\lambda_{h,d,g}) & \sim & N(0,5)\nonumber\\
\text{log}(\psi_{m,g}) & \sim & N(\mu_{m},5)\nonumber\\
\mu_{m} & \sim & N(0,5),\nonumber
\end{eqnarray}
where \( d=1,2, \ldots, 7 \) makes reference to the \( 7 \) days of the week, \( h=1,2, \ldots, 24 \) makes reference to the \( 24 \) hours of the day, \( g \) is one of the proposed grouping methods, \( \psi_{m,g} \) corresponds to the authentication method, Kerberos or NLTM, \(m=\{1,2\}\) for group \( g \). The average for each method within each group is defined as \( \mu_m \).
With regards to the anomaly detection stage, in order to take into account a fully Bayesian framework we adopted the highest posterior density interval (HPDI) to evaluate if a user is deviating from its group. HPDI is a region that contains \( 100(1 – \alpha)\% \) of the posterior distribution’s mass. If a value is observed outside this interval, it can be flagged as an anomaly. Here we are assuming that observed spikes in the authentication counts are associated with malicious events, so only the HPDI’s upper limit is considered.
Security operation center (SOC) analysts are buried with a high number of alerts on a daily basis, of which the majority end up being a false detection. Having this in mind, the adopted metric for our research was the alert rate, i.e., the proportion of alerts that each model produces in the test set. However, bear in mind that as with most post-breach detection scenarios, the data here are not labeled, that is we do not have any information regarding if a true attack took place or not.
Table 2 shows the percentage of all observations in the test set which are labeled as an anomaly, using the 99% HPDI. The total number of observations evaluated in the test set are 439,689. Additionally, the number of clusters provided by each clustering algorithm is also provided in the last row (N groups).
Table 2
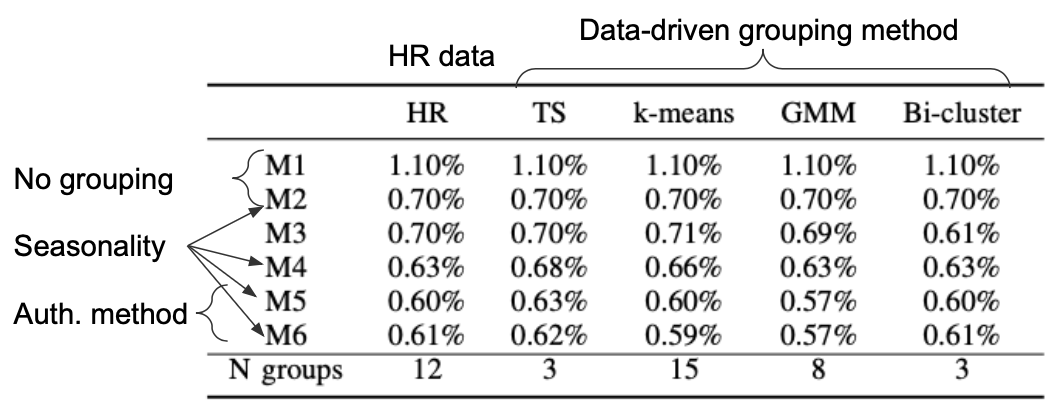
Note that results for models \( M_{1} \) and \( M_{2} \) are the same, regardless of the grouping, since the models are completely pooled. Here we are favoring the models producing the lowest alert rates, which are achieved by models \( M_{5} \) and \( M_{6} \) with the GMM grouping method. Also, note that these alert rates are even smaller than for the default grouping obtained through the HR records. A reduction from 1.10% (\( M_{1} \) with HR grouping) to 0.57% (\( M_{5} \) or \( M_{6} \) with GMM grouping) roughly represents 2,330 fewer alerts for the SOC analyst to evaluate in the test set.
It was expected that HR records were not ideal to group users in terms of authentication behavior. Employees in the same division do not necessarily have the same connectivity pattern. Also, it is not a rare event that employees change their job title within the company or are allocated to other divisions due to budget constraints but keep working in a completely different one. Moreover, the benefit of using the data-driven approaches to user grouping allows us to perform similar analyses even when the HR records are not available, or outdated, which has large benefits for deployment and maintenance of detection technology.
We refer our AAAI-23 workshop paper on Artificial Intelligence for Cyber Security [1] to the interested reader. There you can find more details about the project, including the data overview, statistical models, technical nuances and more detailed empirical results.
[1] Hawryluk, I., Hoeltgebaum, H., Sodja, C., Lalicker, T., & Neil, J. (2022). Peer-group Behaviour Analytics of Windows Authentications Events Using Hierarchical Bayesian Modelling. arXiv preprint arXiv:2209.09769.
[2] Perusquía, J. A., Griffin, J. E., & Villa, C. (2022). Bayesian Models Applied to Cyber Security Anomaly Detection Problems. International Statistical Review, 90(1), 78-99.
[3] Dhillon, I. S. (2001, August). Co-clustering documents and words using bipartite spectral graph partitioning. In Proceedings of the seventh ACM SIGKDD international conference on Knowledge discovery and data mining (pp. 269-274).
[4] Vehtari, A., Gelman, A., Simpson, D., Carpenter, B., & Bürkner, P. C. (2021). Rank-normalization, folding, and localization: an improved R for assessing convergence of MCMC (with discussion). Bayesian analysis, 16(2), 667-718.
[5] Turkkan, N., & Pham-Gia, T. (1993). Computation of the highest posterior density interval in Bayesian analysis. Journal of statistical computation and simulation, 44(3-4), 243-250.